Trae Dorn
Election Turnout and the Entry Level Voter
Introduction
It is no secret that people between the ages of eighteen and twenty-four are less likely to vote than any other age demographic. While youth vote campaigns have existed for quite some time, in recent years even a larger focus has come on to the issue. While the sheer statistics of the low turnout of the youth vote are quite obvious and irrefutable, the reasons behind it are not quite apparent. While many focus on a perceived apathy towards politics, my own prior research has told me that there is likely nothing exceptional about the youth demographics that don't affect older voters (Dorn, 2004). After looking at variables including relative trust in government, whether or not someone felt the government cared what a person thought, and whether or not a person felt that their vote counted, at best I could only conclude that a possible contributor for low youth turnout was an indifference towards voting; however, this relationship was not strong enough to account for the significant difference between the youth vote and other age demographics.
That in mind, this article proposes a wholly different concept: The primary reason younger voters don't show up to the polls is simply because they aren't used to voting in the first place. If you don't think to vote, you won't. It's a fairly straightforward concept, and one which is often overlooked in reports on youth voting. To steal a quote often associated with the tobacco industry, "You've gotta hook 'em while they're young." Human beings are creatures of habit, and the more they are trained to do something, the more likely they are going to do it on their own.
In an attempt to quantify this, rather than focus on the traditional eighteen to twenty-four year old demographic used so often to refer to the youth vote, I will look at the slightly older, but similarly sized, twenty-one to twenty seven year old demographic. By looking at the voting behavior of this group both before and after the voting age was lowered from twenty-one to eighteen with the Twenty-Sixth Amendment, perhaps I can hope to shed some light on whether or not low youth voter turnout is due to some complicated societal issue, or whether or not it's just a matter of habit.
Literature Review
Studies on youth voter turnout are nothing new, and extensive research has been done on the subject since the 1960s (Milbrath, 1965). Before diving into what inspired the "habitual" line of thought, it may be best to look at other's research done on nonvoters. Hazel Erskine (1971) noted that turnout within twenty-one to twenty-four year olds was only 34% in the 1970 midterm election. Meanwhile, in the just slightly older demographic group of twenty-five to twenty-nine year olds, there was a 58% voter turnout. The reasons members of the younger generation were less likely to vote, according to Erskine, were related more towards the reluctance of new voters and the higher mobility of young people (making residency requirements for registration harder to fulfill). This is not just a matter of American voter turnout as well. Norman H. Nie, Sidney Verba and Jae-on Kim (1974) noted that the youth demographics were less likely to vote than those just ten years older than themselves no matter what democracy you looked at. But still, the twenty-five to twenty-nine year olds of 1970 hadn't always been so active themselves. One has to ask, when or how did this change occur?
Thomas J. Agnello Jr. (1973) may have an answer for this question, pointing out that the unlikely to vote twenty-three year old of 1972 is also the much more likely to vote twenty-seven year old of 1976. In his research, Agnello looked at turnout levels from 1952, 1960 and 1968. He believed that as a person grows older that they begin to feel less powerless as they approach middle age. In this vein, Agnello inferred that the level of powerlessness a person felt in government was an influence on their likelihood to vote. To consider it the only reason though, Agnello explained, would be a mistake. Agnello's own research showed that elderly voters were more likely to feel powerless in the political system as well. He surmised that this may be caused by the increased feeling by the elderly that voting is their only voice of power in the political system. Agnello would not be the only person to state that powerlessness is likely to cause someone to not have faith in the government, as Joel D. Aberbach also stated something very similar in his research in the differences in political behavior between races (Aberbach, 1977). But we must keep in mind though, that not feeling confident in the government does not necessarily indicate that a person might not vote.
Ragsdale and Rusk (1993), like Aberbach (1977), do not specifically look at eighteen to twenty-four year olds, but rather nonvoters in general. Ragsdale and Rusk have developed five nonvoter archetypes to describe what they believe to be the majority of nonvoters. The problem faced when trying to apply these findings to new voters is that none of their archetypes seem to be generally applicable to the youth population as a whole. Their oversimplification in many ways limits their model for this application.
Beck and Jennings (1979) posited that while young people (during the time span of their study in 1970s) were more likely to be politically involved than the older generation, the older generation was still more likely to vote. Beck and Jennings asserted that political participation is more than mere voting. Beck and Jennings claimed that while the older generations were more likely to do a few things (donate to campaigns for instance), during the time of their study, the younger generation was more likely to be involved in most other non-voting political activities. Of course, this does not do anything more than add to the confusion of why the apparently more politically aware youth of the early and mid-seventies wasn't actually voting as well.
William Lyons and Robert Alexander (2000) suggested that the primary problem with voter turnout, and the cause of its overall decline, has to do with generational replacement. While this may account for some of the drop off in youth voter turnout, it surely can't be the reason that there was still a significantly lower number of young voters twenty years ago, as that particular group of people now makes up those who are much more likely to vote today.
Donald P. Green and Ron Shachar's (2000) research may end up holding the key though. While not looking at youth turnout in particular, they focused on how prior voting increased a person's likelihood for future voting. Green and Shachar found that a person who voted in an election was significantly more likely to return to the polls for the next Election Day than someone who hadn't. While they preferred the term "consuetude" over habit, due to its lack of a common connotation, the concept is none the less the same.
Eric Plutzer's research (2002) also agreed with Green and Shachar's (2002) assessment of voting behavior, classifying people as habitual voters or as habitual nonvoters. Plutzer also pointed out that all of us start out as habitual nonvoters, and that the behavior must be learned. Of course, in Plutzer's own research (1997), he points out that how we begin this habit is relatively difficult to ascertain. Changing nonvoters to voters is in fact one of the most difficult things to do in American politics (Beinart, 1989), but that is a completely different problem altogether though.
Green and Shachar, joined by Alan S. Gerber, would later test this idea (Gerber, Green and Shachar, 2003). In this research, one group of candidates was directly campaigned to using direct mail, face to face canvassing, telemarketing, along with other various contact methods. A control group was also organized, but effectively left alone. Those campaigned to, of course, were observed to be more likely to vote than their control group counterparts. What Gerber, Green and Schachar also found though was that this same group was also more likely to vote in the local election one year later, even though contact had stopped. Gerber, Green and Shachar concluded that just by having previously voted, a person would be more likely to do so in the future.
Data and Methodology
As previously mentioned, if the primary reason that youth voter turnout is lower relative to other age groups is force of habit, rather than study the eighteen to twenty-four year old demographic post-Twenty-Sixth Amendment, it would be better to look at a similarly sized group both before and after the shift in the voting age to see if there is any significant change in that age group's voting behavior. For this purpose, the focus of this paper's analysis will be on twenty-one to twenty-seven year olds, comparing their relative behavior both before and after the shift in voting age.
The data used for this paper comes from the American National Election Studies Cumulative Datafile, 1948-2004 which is a cumulative file of surveys regarding Presidential and Congressional Elections. The ANES is managed jointly by Stanford University and the University of Michigan. The dataset they produce measures, amongst many other things, whether a person has voted, the respondent's age, the respondent's gender, and his or her opinion on a plethora of topics.
The data has been recoded to reflect a new variable. The ANES Cumulative Datafile contains both a variable for age, and a variable for age group (breaking down demographics into the easily recognizable groups like seventeen to twenty-four, twenty-five to thirty-four, etc.). For the purposes of this paper though, a new age grouping has been created. The first group selected for this variable is twenty-one to twenty-seven year olds. A control group has also been created out of respondents aged sixty-one to sixty-seven, as there should be a decreased affect created by the respondent's habits by this age. The rest of respondents have been coded into a third variable indicating merely that the respondent does not belong to either the twenty-one to twenty-seven year old group, or our control group.
Another new variable that has been coded into the dataset is merely whether an election took place prior to or after the passing of the Twenty-Sixth Amendment in 1971. All elections held prior to this date have had the variable simply coded as pre-1971, while those occurring after have been coded as post-1971. This will allow the largest possible sample to be taken, reducing the chances that individual issues that may only be relevant for a single election do not disrupt the statistics.
The first piece of data that will be analyzed is whether or not age is a significant contributor to whether or not a person is likely to vote. While it may seem fairly obvious, without establishing this baseline there is nowhere to possibly interpret any following information. This portion of the analysis will be brief, and focus on comparing our twenty-one to twenty-seven demographic to our control group of sixty-one to sixty-seven year olds. For the sake of thoroughness, the Presidential and Congressional midterm elections will be looked at separately.
As overall voter turnout amongst all age groups has actually declined throughout this time period, developing an appropriate metric to measure any relative increase is difficult. In an attempt to deal with this, this paper will focus on the relationship between the percentages of twenty-one to twenty-seven year old voters with that of our sixty-one to sixty-seven year old control group. Presidential and Congressional midterm elections, due to their distinctively different turnout numbers, will be analyzed separately in hopes to provide the most accurate results.
As this particular paper is looking at voting behavior since the mid-twentieth century, the data will be looked at in two forms: one where all respondents are calculated, and again where the data has been truncated to only include respondents who are male and racially white. This will hopefully help to reduce any unrelated shifts in voting behavior related to the civil rights and feminist movements of the mid to late twentieth century.
Analysis
As stated previously, this analysis will begin by looking at whether or not age is a significant factor in whether or not a person will vote. To do this, I will compare turnout numbers between the test group (twenty-one to twenty-seven year olds) and the control group (sixty-one to sixty seven year olds). Table 1 displays the percentage break downs of the voting percentages in both age groups for presidential elections. It is immediately obvious at first glance that consistently sixty-one to sixty-seven year olds have a much higher turnout percentage than twenty-one to twenty-seven year olds.
Table 1
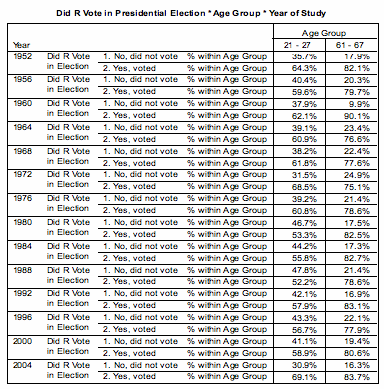
Table 2, which follows, shows the Cramer's V relationship for each selected election year. The Cramer's V calculation for each year (with the exception of 1972, which had a spike of younger voters) clearly shows a moderate relationship between age group and voting behavior in most cases. With most significance scores sitting below a .001 (again with the exception of the 1972 election and its abnormal significance of .092), we can gather that for most years this is not random chance.
Table 2
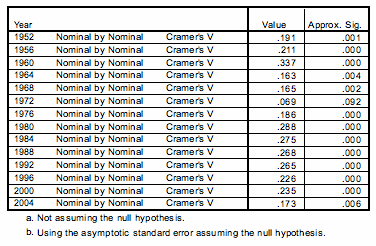
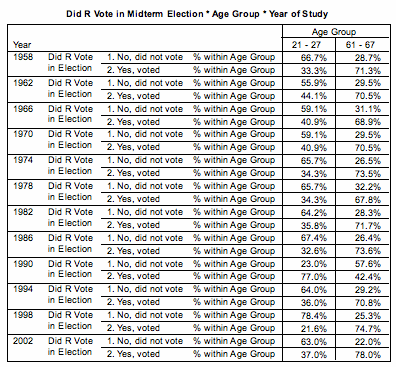
Table 3 displays turnout information for Congressional midterm elections. Like Table 1, it is obvious that there is a significantly higher turnout of sixty-one to sixty-seven year olds than twenty-one to twenty-seven year olds. It should also be clear though that the percentage of voters in Congressional midterm elections (at least within the two age groups displayed) is lower than Presidential elections by a fairly sizable margin.
Table 3
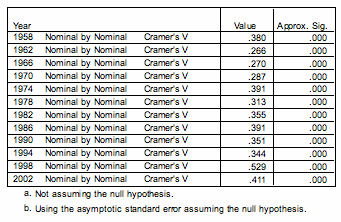
The Cramer's V scores relating age group with voting behavior for midterm elections show a much more dramatic relationship in Table 4 than we previously saw in Table 2's Presidential scores, most expressing a moderate to strong relationship. With all significance scores sitting at approximately .000, it is fairly apparent that there is a clear connection here, and not based on random chance.
Table 4
Now that a clear relationship between which age group the respondent belongs to and the respondent's voting behavior has been established, the question of habit can begin to be breached. The first data that will be examined is comparing is a collapsed form of the prior data, instead considering all Presidential elections prior to 1972 as a single category, and all Presidential elections 1972 and after as another (Table 5). At first, this may seem to run counter to any held expectations. Indeed, it appears that the number of twenty-one to twenty-seven year olds voting has actually decreased after 1972, while sixty-one to sixty-seven year olds has remained almost exactly the same.
Table 5
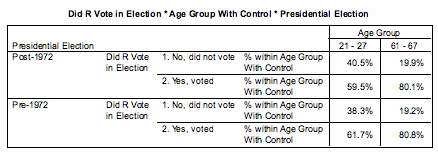
The Cramer's V score for the Pre-1972 relationship is actually weaker than the Post-1972 relationship between age and voting behavior (Table 6). While only a slight increase, as both are moderate scores, this still indicates a stronger relationship after the voting age change. This is, of course, the opposite of what was originally expected. What must be noted though, is that this calculation does not take into account other cultural factors which may have influenced voter turnout during these years, including such major events as the Vietnam war and the Civil Rights movement. To deal with that, the calculations will be rerun with consideration only given to respondents who are white males. This will ensure that most, if not all, cultural factors should effect both age groups more equally.
Table 6

Table 7
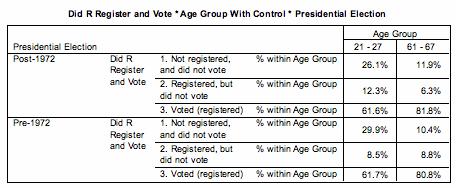
Table 7 shows a similar set of data as Table 5, this time taking into account whether or not respondents who stated they were nonvoters were registered to vote or not. What is interesting is, at first glance, how many more post-1972 nonvoters in the twenty-one to twenty-seven year old demographic are registered compared to their pre-1972 counterparts.
Table 8
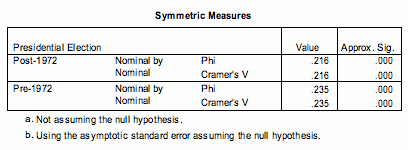
Table 8's measures of Cramer's V differ from the measurements we found in Table six considerably. While both are moderate relationships, there is the expected decrease from pre-1972 to post-1972 now that voter registration has been considered as a part of the equation. The difference here is small though, so while not contradicting previously set expectations, it does nothing to confirm them either.
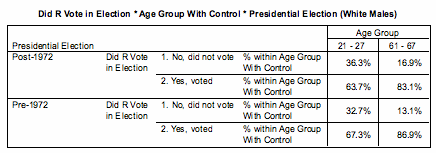
As can clearly be seen in the data, only considering white, male respondents has managed to change the calculation (Table 9). While we still see a decrease in voter turnout in ages twenty-one to twenty-seven, we also note a decrease in the sixty-one to sixty-seven year old group. This can be explained easily, as even just glancing at the data, and looking at all age groups collectively, there is an indication of a drop in white male voter turnout at some point after 1972 (Table 10).
Table 9
Table
10
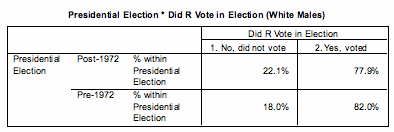
Running Cramer's V on the data shows us some interesting results (Table 11). The Pre-1972 value is a .230, while it drops to a .212 after 1972. While these are both moderate relationships, it would seem to indicate that age became less of a factor in the difference between these two age groups after 1972. With significance scores at .000, it seems unlikely that this is random chance. Although the numeric move in this case seems to match the expectations of what should happen if habit is truly a motivating factor in voter turnout, it is far from rock solid, as both relationships in this particular case are still moderate, and within a very narrow margin of each other.
Table 11
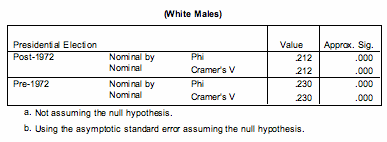
Table 12
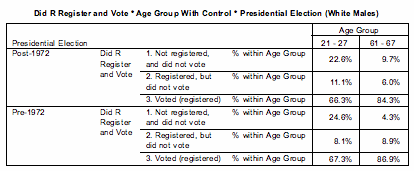
Table 12 looks once again at whether or not the nonvoters are registered, but instead this time with the focus of only white males being considered. One noticeable difference when comparing this to Table 7 is that the white males, across the same election year, seem more likely to vote than the average respondent.
Table 13
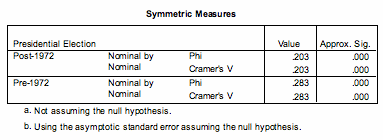
Table 13 shows the Cramer's V calculations for Table 12, and the results are interesting. Between the Pre-1972 and Post-1972 composites, the relationship between voting (and being registered to vote) and age changes from a moderately strong relationship (.283) to a moderate relationship (.203). With that significant a change, it may just go towards confirming what has been predicted.
As seen earlier within this text (Table 3), Congressional midterm elections have a significantly smaller number of voters than Presidential elections. Because of that, if one is testing for habitual behavior, it may in fact be a better test. We start then by returning to the general populace as the immediate metric. In Table 14 it can be seen that turnout in general has dropped in both of these age groups after the 1972 shift in the voting age.
Table 14
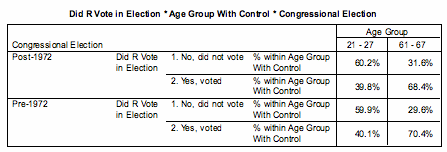
Running Cramer's V on these numbers though returns some interesting results (Table 15). Both the Pre-1972 and Post-1972 values for Cramer's V are moderately strong (.299 and .280 respectively). While one can see a decrease in strength from Pre-1972 to Post-1972, and the values both are very significant (with values of about .000), the change is still too small to find anything remarkable. While these measurements don't go against expectations, neither do they do anything to confirm them either.
Table 15

Again, what will happen here is the same tests will be run, instead isolating the white male respondents in an attempt to separate out any cultural shifts from the data. Table 16 displays the voter turnout for white male turnout in midterm elections both pre-1972 and post-1972. The advantage to this data is that the anomalous behavior surrounding 1972's high youth voter turnout should not have an effect, as 1972 was not a midterm election. As seen in the overall numbers for sixty-one to sixty-seven year olds, the number of white males between the ages of sixty-one and sixty-seven has dropped post-1972. We see though in Table 17 that it is not just our control group, but that overall voting for white males has gone down across the board, regardless of age.
Table 16
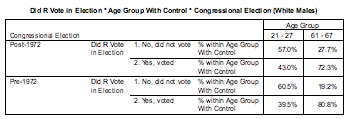
Table 17
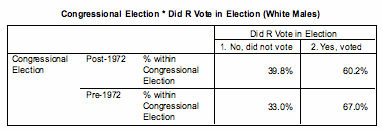
Table 18
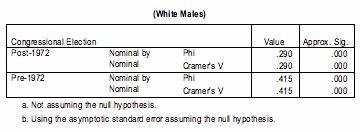
Analyzing the Cramer's V from this particular data provides more interesting than the other three seen previously (Table 18). Where before there had been only small margins of change, the Cramer's V values for the relationship between age and voter turnout for white males change dramatically from the Pre-1972 to Post-1972 composites. The Pre-1972 value of .415 is an incredibly strong relationship between age and voting behavior in midterm elections for white males. The significance score is still a .000, implying that this high score is likely not due to a statistical fluke. The post-1972 value though is only a .290, which while a implying that there is still a moderate relationship between voting behavior and age group, that it is far less influential now. That sort of dramatic drop, while not necessarily meaning that it is due to an increase in habit is very much expected if my hypothesis is true.
Conclusion
When people begin to ask what it will take to get more eighteen year olds to vote, the simple response is "Lower the voting age to fifteen." While it cannot be said for absolute certainty that a lack of habit is the primary reason that younger voters don't come to the polls as often as their older fellow citizens, it can be said that age matters less now than it did forty years ago as a determinant as to whether a person will vote for those who were at one time the "entry level" voters. This indicates to me that the lack of young voters is not so much a societal epidemic but a natural process. At some point everyone is a nonvoter and has to develop the habit, regardless of where they are from. Apathy is more rampant in all age levels than post people think, and it is not something special for the young.
With the great consistency of numbers, a person in their mid-twenties, if all things were equal, is more likely to vote after the voting age was lowered with the passage of the Twenty-Sixth Amendment in 1971. While I do not feel certain that I can say this behavioral shift is completely due to newly formed habits found by whatever contemporary group of people currently occupies that demographic, it has shown to be more likely than any other reason I have previously looked at. Further research needs to be done on this topic if one is to ever understand the effects of "Consuetude" (as Green and Shachar would say) if it is to ever be truly understood, and while the word habit gets bandied about it is very difficult to find many actual studies on it's effects on behavior in American politics.
The question remains though, if low voter turnout amongst eighteen to twenty-four year olds is due to a lack of consuetude, what on earth can be done to change that? Every election cycle, there is a new group of inductees to this age group, and some of those who had been within it move out just as quickly. Age groups are a fluid thing, and whatever plan to shift that sort of behavior needs to be a long term one. How do you go about changing what someone is used to?
Today's twenty year olds will be the much more likely to vote thirty year old in ten years, and will be the even more likely to vote sixty year old in forty. At some point all members of heavily voting demographics were members of low voting demographics. While it may very well be important that young people get more proactive in politics and their own voting behavior, it is important to realize their behavior is nothing new. In fact, it's what everyone has been doing all along in the first place.
Bibliography:
Literary:
Aberbach, Joel D. 1977. "Power Consciousness: A Comparative Analysis." American Political Science Review 71(4):1544-1560
Agnello, Jr., Thomas J. 1973. "Aging and the Sense of Political Powerlessness." Public Opinion Quarterly 37(2): 251-259
Beck, Paul Allen and M. Kent Jennings. 1979. "Political Periods and Political Participation." American Political Science Review 73(3):737-750
Beinart, Peter A. 1989. "The Real American Voting Problem." Polity 22(1):143-156.
Dorn, E.T. 2004. "Indifference and the Voting Patterns of Eighteen to Twenty-Four Year Olds." Unpublished Manuscript.
Erskine, Hazel. 1971. "The Polls: The Politics of Age." Public Opinion Quarterly 35(3): 482-495
Gerber, Alan S., Donald P. Green and Ron Shachar. 2003. "Voting May Be Habit-Forming: Evidence from a Randomized Field Experiment." American Journal of Political Science 47(3): 540-550
Green, Donald P. and Ron Shachar. 2000. "Habit Formation and Political Behaviour: Evidence of Consuetude in Voter Turnout." British Journal of Political Science 30(4): 561-573
Lyons, William and Robert Alexander. 2000. "A Tale of Two Electorates: Generational Replacement and the Decline of Voting in Presidential Elections." Journal of Politics 62(4):1014-1034
Milbrath, Lester W. 1965. Political Participation. Chicago: Rand McNally.
Nie, Norman H., Sidney Verba and Jae-on Kim. 1974. "Political Participation and the Life Cycle." Comparative Politics 6(3): 319-340
Plutzer, Eric. 1997. "Voter Turnout and the Life Cycle: A Latent Growth Curve Analysis." Presented at the Midwest Political Science Association's annual meeting, Chicago.
Plutzer, Eric. 2002. "Becoming a Habitual Voter: Inertia, Resources, and Growth in Young Adulthood." American Political Science Review 96(1): 41-56.
Ragsdale, Lyn and Jerrold G. Rusk. 1993. "Who Are Nonvoters? Profiles from the 1990 Senate Elections" American Journal of Political Science 37(3): 721-746
Data Sources:
American National Election Studies Cumulative Datafile, 1948-2004: From http://www.electionstudies.org/
Footnotes:
|


